
Back to Tools PlugITs content page
"Real-time graph" PlugIT
The "Real-time graph" PlugIT Allows to draw a curves graph with data provided in real-time. the graph and curves are fully configurable.
Parameters |
|
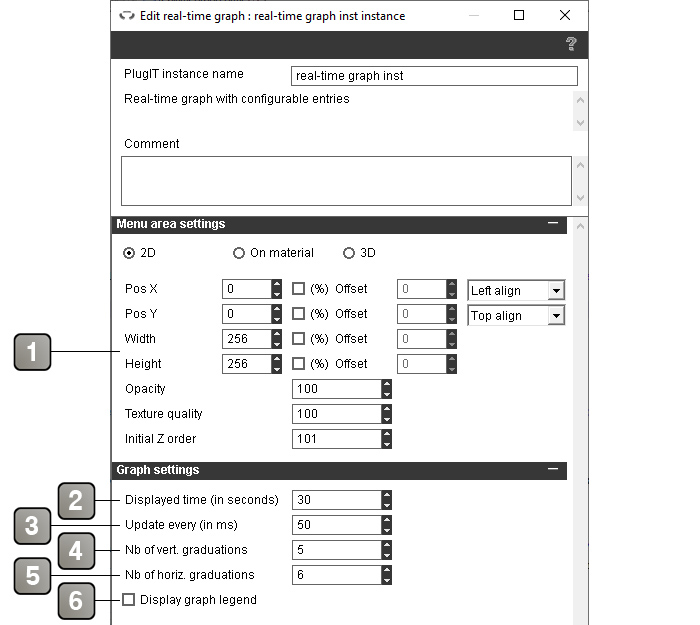
1 |
Interface positioning parameters. For more details, please refer to the interface positioning documentation. |
2 |
Time displayed on the graph in seconds. |
3 |
Time interval between two updates of the graph in milliseconds. Can affect the application performances. |
4 |
Number of graduations displayed on the graph vertical axis in addition to the smallest value. Set to 0 to delete the vertical axis. |
5 |
Number of graduations displayed on the graph horizontal axis in addition to 0. Set to 0 to delete the horizontal axis. |
6 |
If checked, a legend is displayed in the graph with the curves names. |
Parameters (continuation) |
|
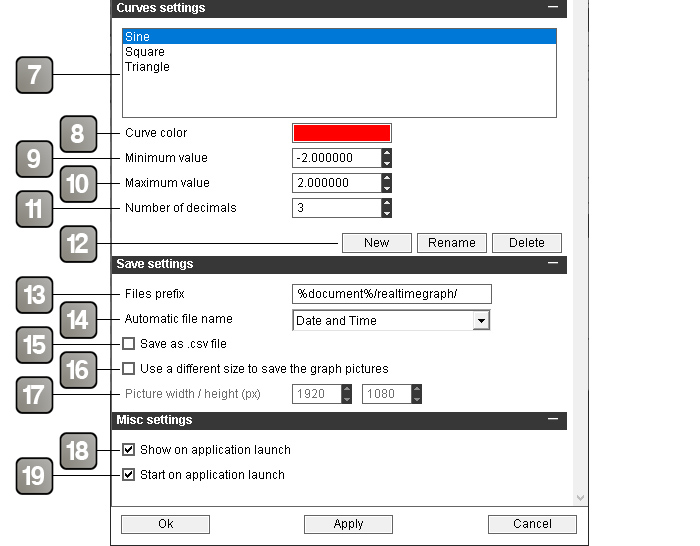
7 |
List of curves displayed on the graph. Click to select a curve. |
8 |
Color of the curve. |
9 |
Minimum value for the vertical scale of the curve. |
10 |
Maximum value for the vertical scale of the curve. |
11 |
Number of decimals displayed on the verticale scale. |
12 |
New : Adds a new curve to the list. |
13 |
Path where the .csv file will be saved. |
14 |
Options for the .csv file name. the name will also include the plugIT name. |
15 |
If checked, the graph datas will be saved as a .csv file. |
15 |
If checked, allows to choose a resolution for saved pictures that differs from the displayed resolution. |
15 |
Allows to choose the resolution of saved pictures. Enabled only if the previous option is checked. |
18 |
Displays the graph on application startup. If the graph has been started, it will draw the curves even it is not displayed on screen. |
19 |
Starts to draw the curves on application startup. |
Action |
|
Input "X" |
Entry point for the curve named "X". |
Show |
Displays the graph on screen. |
Hide |
Hide the graph. |
Save graph picture |
Saves a picture of the graph. |
Start |
Start the drawing of the curves from the data of the inputs. |
Stop |
Stops the drawing of the curves. |
Reset |
Reset the graph. |
Event |
|
Started |
Sent when the curve drawing is started. |
Stopped |
Sent when the curve drawing is stopped. |
Reseted |
Sent when the graph is reseted. |
Values |
Sends the value of each curve every time that the graph is updated. Only sends if the value of at least one of the curves changed. |